Visual making and feedback
When I first encountered the concept of non-linear and linear, I thought that non-linear was very free and had user autonomy because it allowed random access. On the other hand, linear behavior seemed to be unautonomous because it explored in a fixed order. That's why, in order to express the non-linear appearance that I had in mind, I first created a button that would move to a random location on the page when clicked.
It's a button that can move to a random location, but I felt like the user couldn't access it from the location they wanted.
I rethought the concept of nonlinearity through this visual, and realized that nonlinear features do not only exist in randomness. I was also able to think about how to establish user autonomy through this nonlinear structure and what kind of layout would be effective.
After presenting the visuals, I was given the task of defining my own linear and non-linear and creating a website that displayed linear and non-linear characteristics.
reading 'Linked'
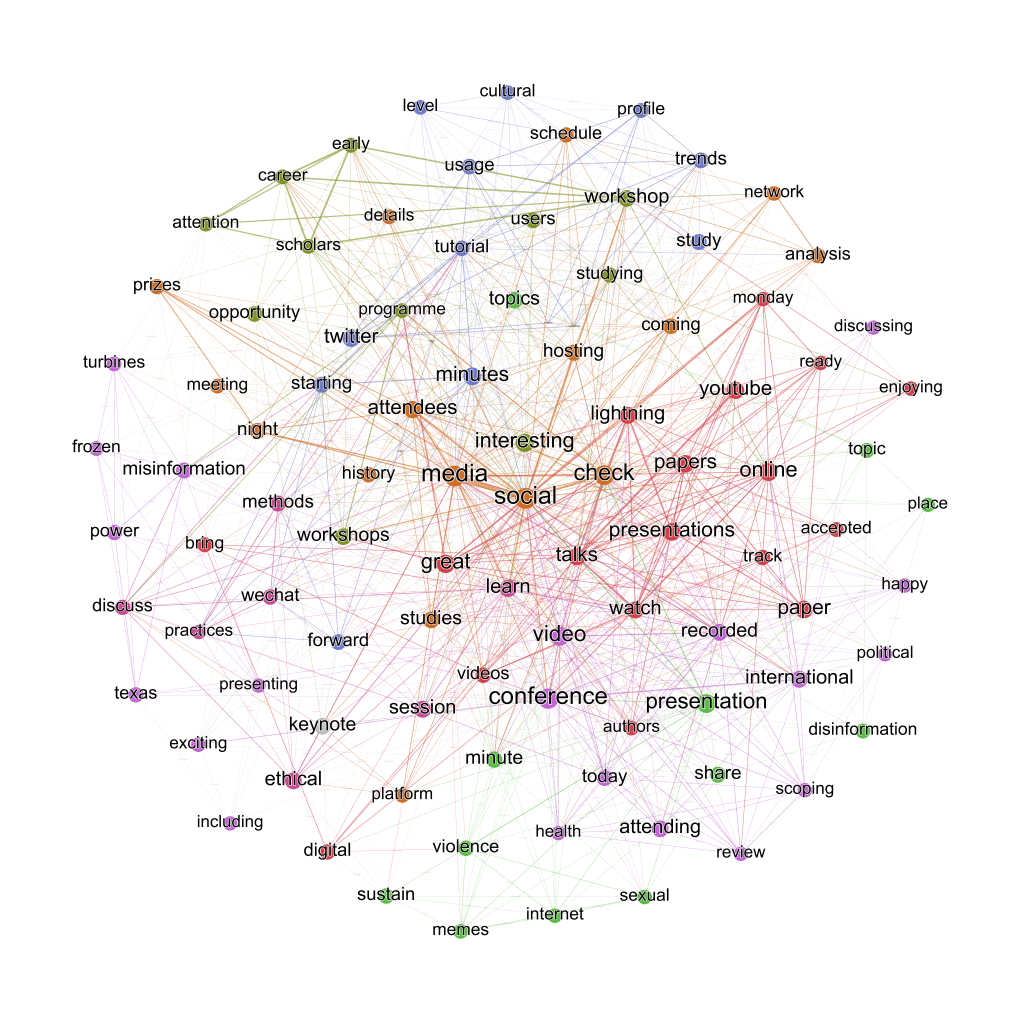
During visual feedback, I referenced various nonlinear models that inspired me, such as network models and semantic models similar to hypertext structures, which led Andreas to recommend the book 'Linked'. This book, centered around network models and network theory, provided valuable insights into the formation of such structures.
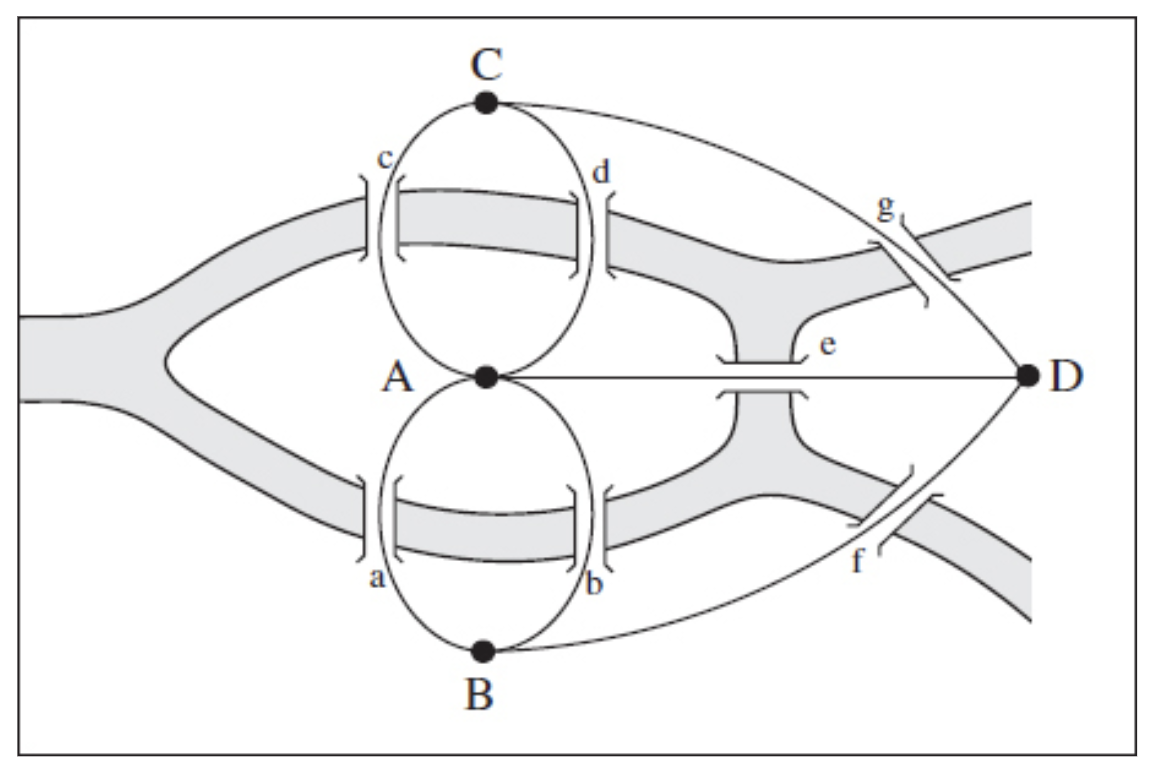
it was difficult because it explained things in terms of scientific topics like physics, but it turned out to be a book that made it easy to understand the network structure through various analogies like the Königsberg Bridge.
It was difficult to obtain the characteristics of non-linear and linear exactly from here, but I got a feel for it after looking into the network model theory with a similar structure to the semantic web.
It was difficult to obtain the characteristics of non-linear and linear exactly from here, but I got a feel for it after looking into the network model theory with a similar structure to the semantic web. The network model, which extends from a single point and has a tree-like structure, has a huge number of links and structures, but we have gained insight that they are all connected in the end. We were able to relate that the non-linear structure is also connected in the end, but the number of choices made at the beginning is large, and the results change depending on those choices.
Visual making through P5js sketch
In "Thesis on the Metaphors of Digital-Textual History", I mentioned browser history and said that non-linear movement by applying time is related to space. Inspired by this, I thought that if we place these elements in space instead of the flat web layout that we usually see, it will be possible to easily navigate and thus non-linear movement will be possible.
I define my definition of non linearity as a dimensional problem - In the real world, we can go to our destination on a set path (we can also go off the path, but there are physical constraints, e.g. we can't go to the sky, we can't pass through a wall, etc.) There are constraints to our destination.
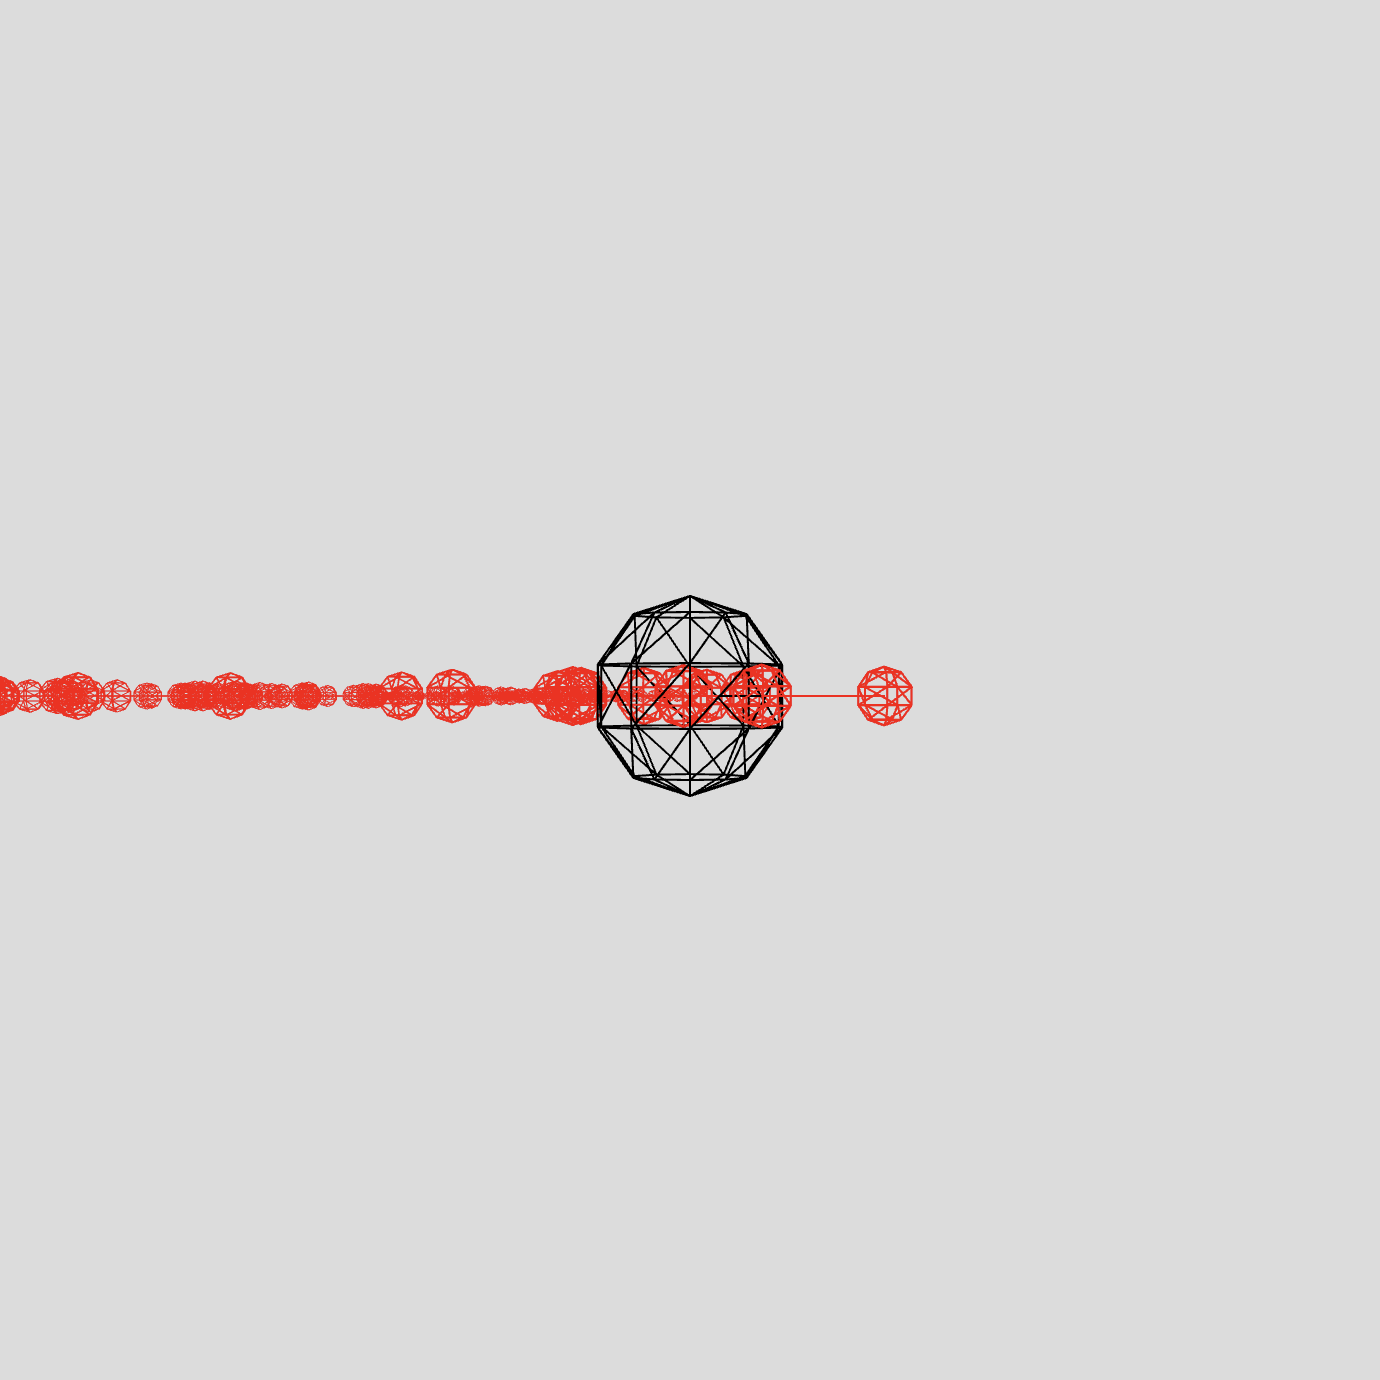
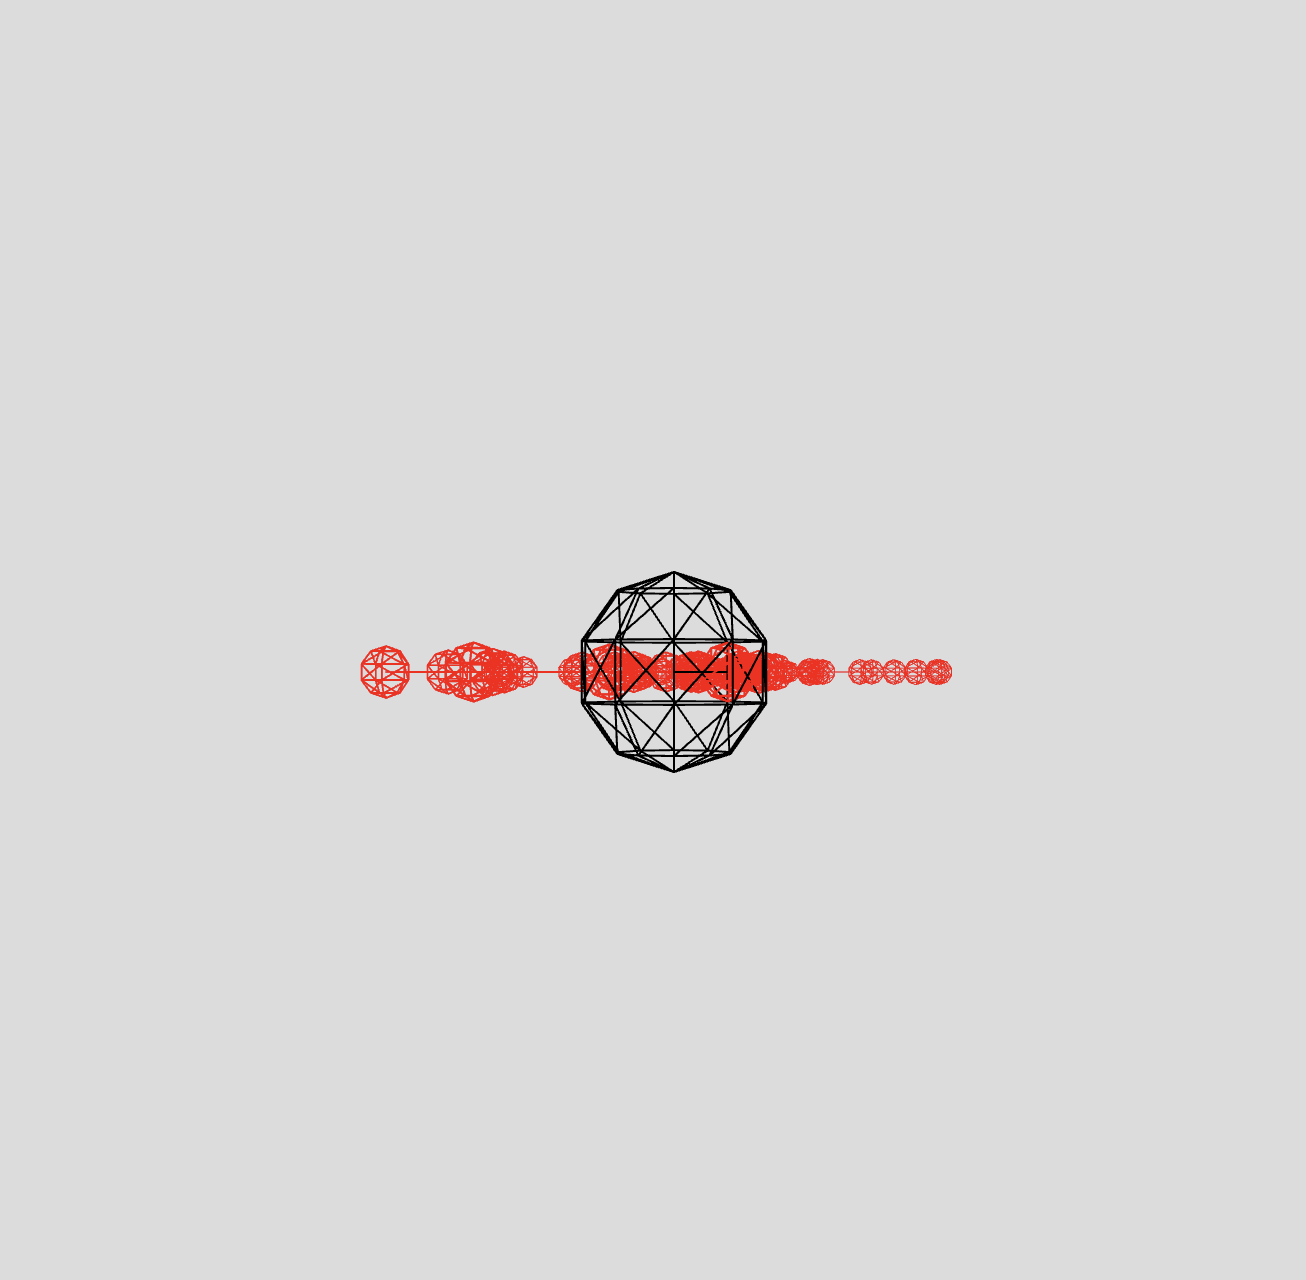
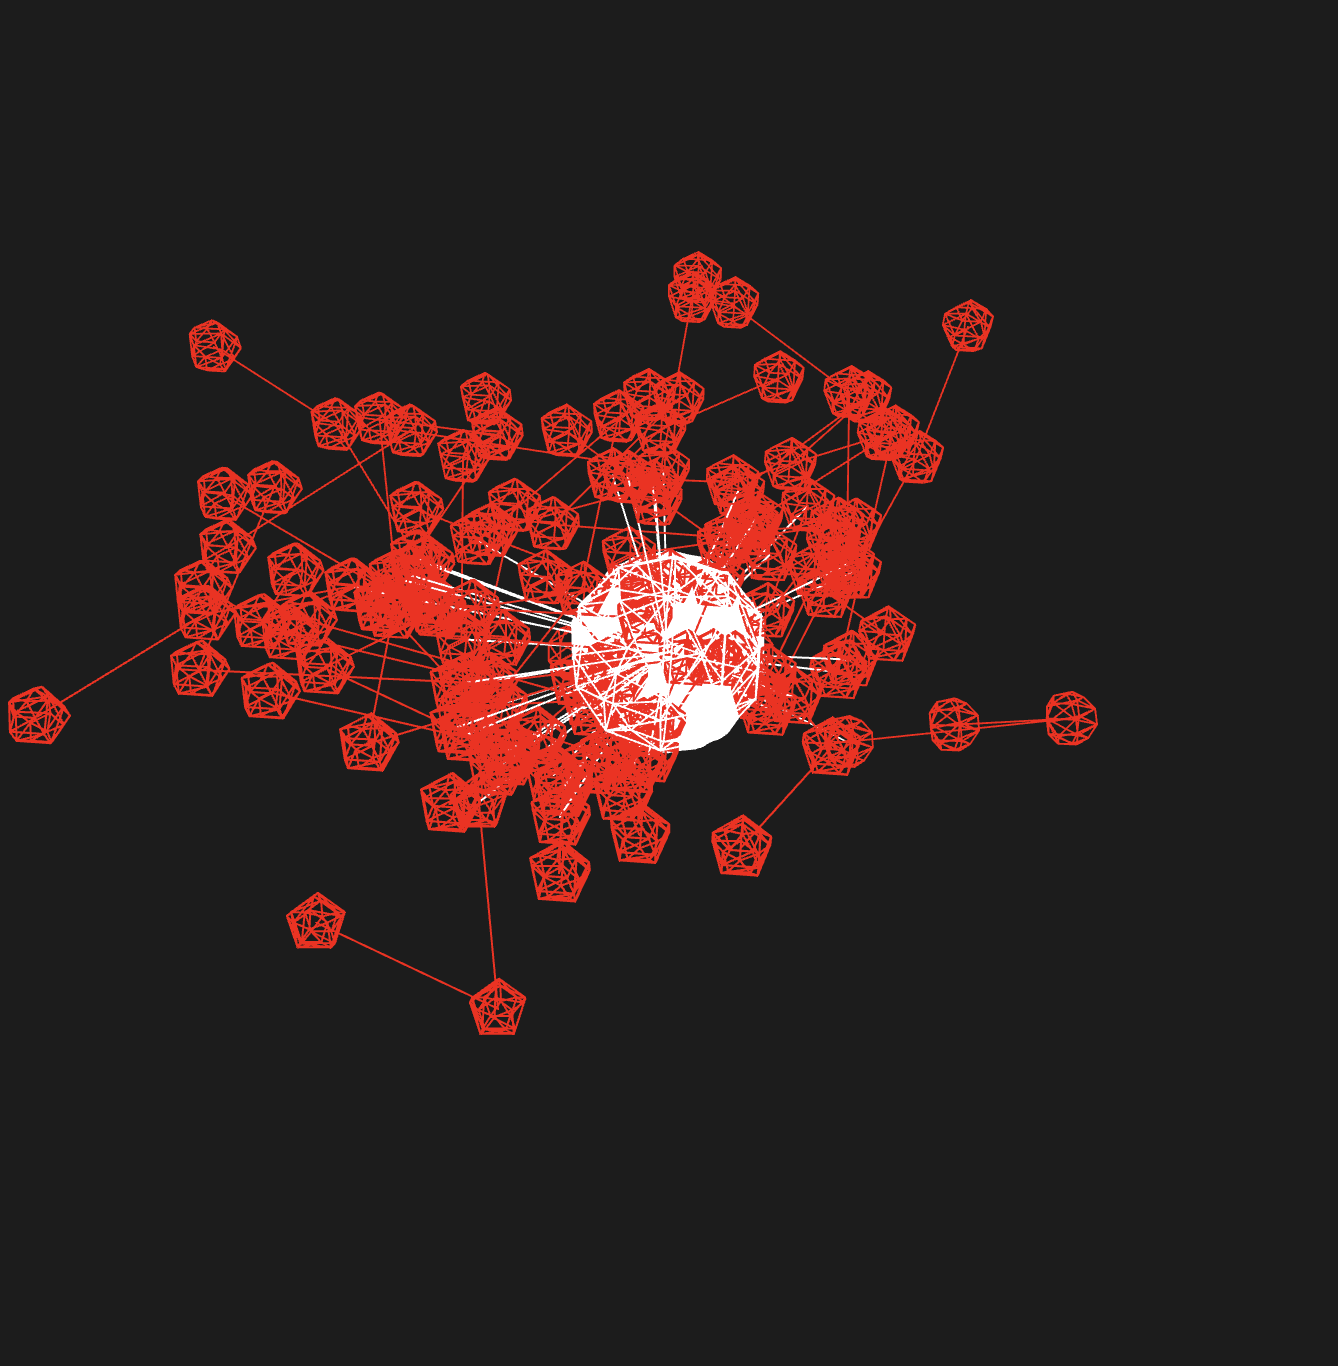
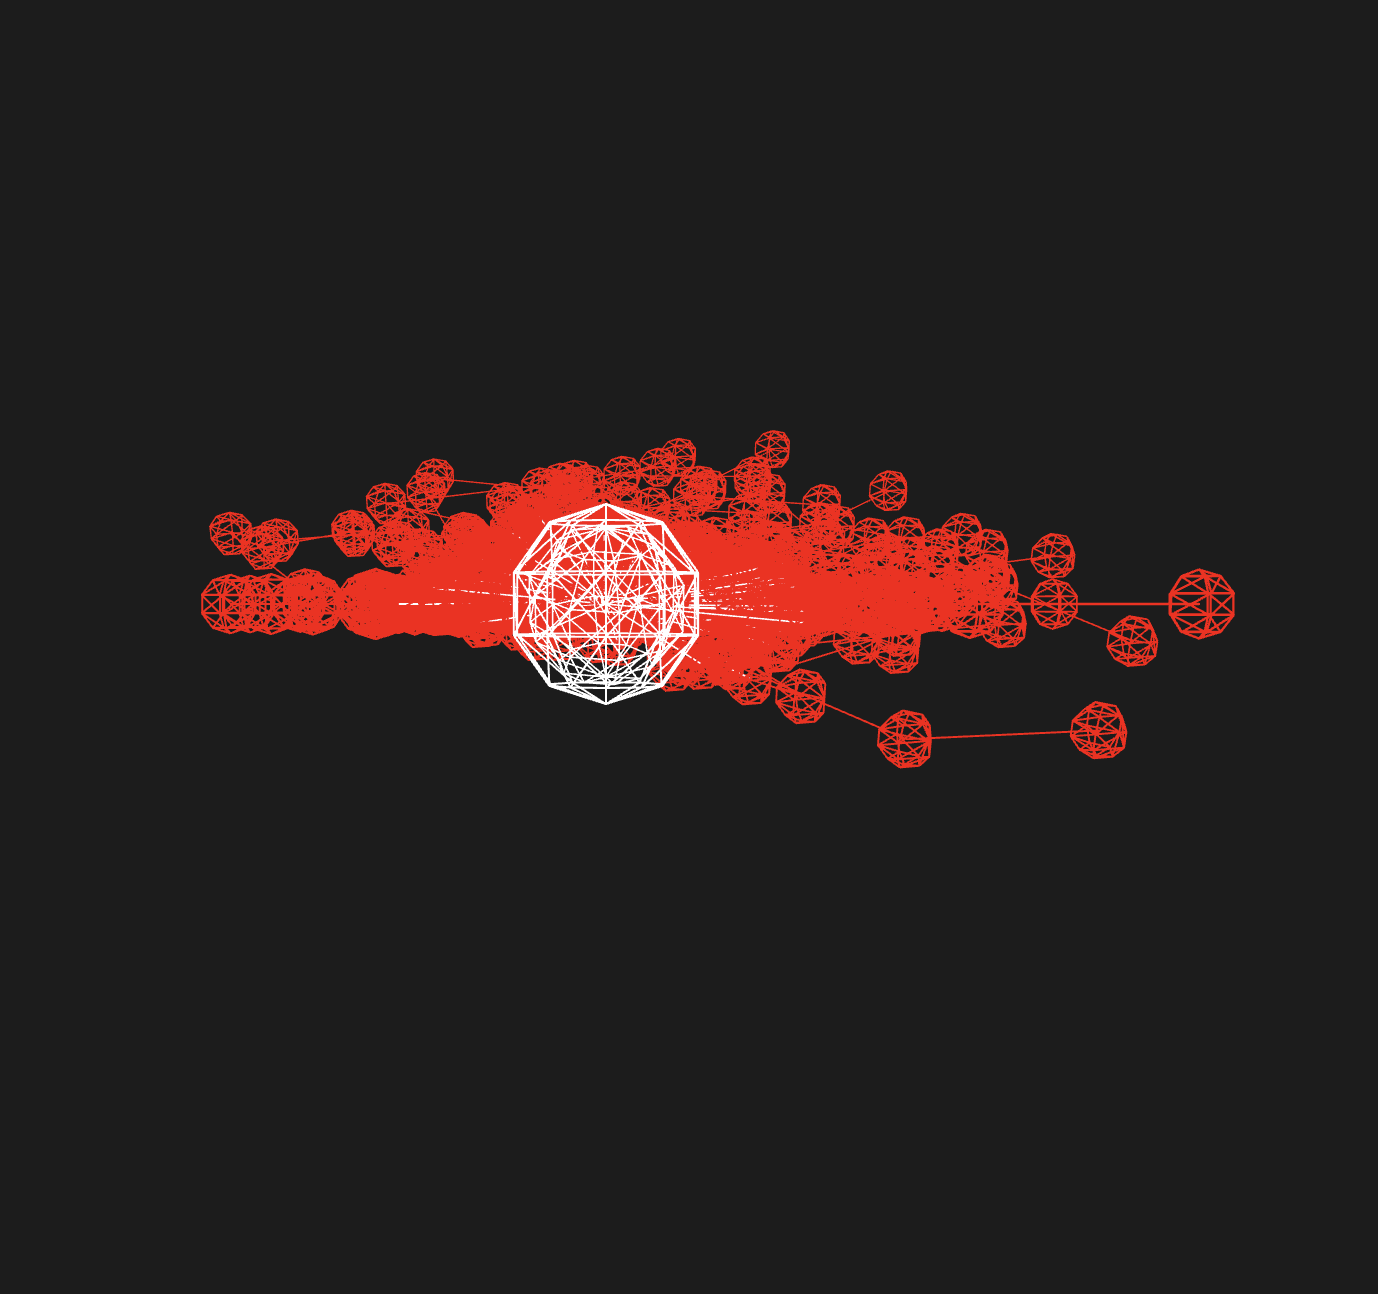
Based on my thoughts on linear and non-linear concepts, I developed a p5.js sketch to explore these ideas further. Drawing from the network structure and spatial elements presented in the Linked book, I constructed a model that visually represents interconnected relationships. In this model, spheres are dynamically generated and linked to a central sphere whenever specific keyboard inputs are detected. The central sphere serves as an anchor point, symbolizing a core idea or node, while the connected spheres illustrate the branching, non-linear connections emerging from it.